
Ratio to Pareto…What’s Best for You?
The social worker profession is truly a noble founded on service, integrity, and clinical expertise. At times, it can be a stressful and hazardous occupation. The nation is grateful for what you do. Thank you!
Today we will talk briefly about certain statistical tools and perspectives that you may want to use in your practice, so you get a better handle on your cases and general work activity. The goal here is to help you work smarter, not harder while managing your risk better.
The first thing to ask is: “What’s my story?” Is your practice driven by a few types of cases, or is it widespread among many diverse case types? Do only a few types of cases take up most of your time? If you own your own practice, is your time drained away by a few types of cases or support activities? Let’s talk about how the following approach can help you.
For example, in the insurance industry, statistics govern decision-making such as who to cover, the perils to cover, and the policy limits and sub-limits. Statistics, referred to as a measure of “experience” by insurance actuaries, predict the probability of outcomes or actual claims losses which then yield a loss ratio. The loss ratio is basically paid claims plus expenses, divided by premium collected. A simple static statistic snapshot in time. More on this later.
“Perils” in insurance are the specific cause of injury or damage. In a professional liability policy, examples include a licensing board complaint, deposition expense, or a negligence complaint requiring legal defense. These perils can result in a reported incident that may become an eligible claim if covered by the insurance policy contract. When the claim is adjudicated and settled or paid, it becomes the loss of a claim. It is charged against the pool of money set aside by the insurance carrier to pay claims as mandated by the insurance regulators.
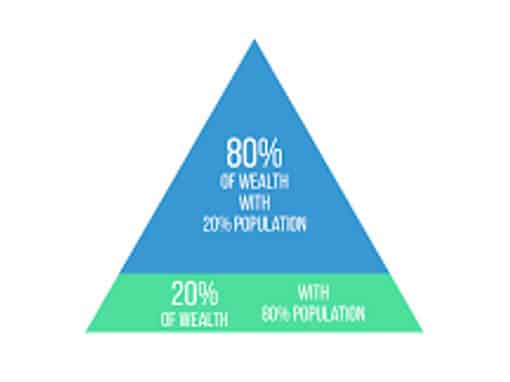
We see first-hand in the Preferra Insurance Company RRG claims experience that a Pareto 80:20 rule exists. About 80% of the paid claims fall into expense categories, as mentioned above. Lawsuits comprise the other 20%, which are called indemnity claims losses. We also sustain a loss ratio in line with A.M. Best expectations. But simply relying on a single statistic does not illustrate the entire scenario. It would be like reporting a ratio that measures X% of successful cases and Y% of unsuccessful cases among all 100% of your cases in clinical social work. Sort of a static statistic, helpful but not too thorough, and certainly not sufficient to make clinical treatment course corrections in any granular way.
Before we continue, the term “Pareto principle” was named after the sociologist and engineer Vilfredo Pareto (pa-Ray-toh) (1848 – 1923); who found that a “power-law” applied between two variables whereby when the relative change of variable “A” changes, the proportional relative change of the other variable “B” changes by a factor of 4. Essentially like a logarithmic or exponential relationship. The assertion is that the relationship between inputs and outputs is not in balance. For example, the squeaky wheel gets the grease; (i.e., time, attention, and resources). So too, do certain claims cases and certain clinical social work cases. So the relative data peculiarly does not fit a standard statistical bell curve. Rather, it fits a probability density function. Examples are illustrated below:

One of the most important statistical measures that the insurance carrier and actuaries rely on is the claims loss ratio. Again, it is a simple and static statistic. To repeat, it is the relationship of incurred claims losses paid, plus loss adjustment expense (legal defense costs mostly), divided by the earned premium paid by the policyholders or the insureds. The loss ratio is used to determine the insurance company’s profitability and compliance with insurance regulators and standards. If loss ratios get out of control, the insurance carrier is, by law, forced out of business by the insurance regulators. Insurance carriers evaluate lines of business by their respective loss ratios. They also look below the line of business, such as medical malpractice or professional liability, to actual category loss experience within professional liability. They analyze the frequency and severity of specific perils and claims losses and examine licensing board complaints, deposition expense, and negligence complaints.
Auto insurance carriers are another example. If an insured has a driving history with frequent DUI arrests, speeding tickets, or accidents, the insurance premium rates increase to reflect the large loss ratios and potential risk of loss from these categories. Reckless driving convictions typically increase premiums by at least 50%. (Insurance Panda, Nov. 23, 2019). Typically, a few bad drivers have severe claims and thus disproportionately increase the claims loss ratio for the entire insured block. Again, the “power-law” principle of Pareto is at work here. Insurance carriers study these severe claims categories’ outcomes to understand better how the respective probability density functions work. The most severe and frequent claims categories can be set to a Pareto chart, analyzed, better understood, and acted upon granularly to mitigate damage and claims losses.
Regarding professional liability insurance policy claims, we look at the individual claims experience loss ratio initially to verify that we have a “heartbeat,” so to speak and that the business is healthy and alive. Next, we use Pareto tools to examine the frequency and severity of various perils and their related claims losses paid.
Below is a simple Pareto chart that shows how the “power-law” relationship works in our insurance business. The most frequent claims loss categories are illustrated and combine to a little below 80% in frequency. Note that they are also a little above 80% of the dollars paid in claims losses.
You can list your practice service model categories (perhaps 5 to 8 categories) and assign variables that you deem important such as time allocated, related case documentation, related costs, and related billings to get an idea in Pareto chart form so you can better understand your work and make targeted adjustments. Again, note that they closely approximate the Pareto “power-law” relationship in claims loss dollars and claims case frequency.

In summary, ratios are useful, but they are only directional static indicators of the entire enterprise or service model. Ratios do not provide the granular understanding that a Pareto perspective provides, which may reveal an entirely new perspective and understanding for you to take corrective action. Pareto analysis works in risk and insurance claims management, so it will likely work for you.
Thank you for all that you do as first responders and as ongoing behavioral health and social work providers. It is truly a noble profession needed now more than ever. Good luck and stay healthy!
